Most monitoring tools show you the headline numbers: solar coming in, battery percentage, grid in or out. That is perfect for a daily glance. But when something looks off, a handful of numbers is not enough. You want to see everything your system is actually measuring. That is exactly what Hyper Mode is built for.
The full firehose of EG4 telemetry
Behind the friendly dashboard, your EG4 system records a remarkable amount of detail every few minutes. Hyper Mode surfaces all of it: roughly 100 chartable signals per inverter. That includes per-MPPT string voltage and power, battery pack voltage and state of charge, individual cell minimum and maximum voltages, cell temperature spread, heatsink temperatures, grid voltage and frequency on each leg, EPS and backup output, generator input, and more.
Every one of those signals is labeled in plain English with a short description, so you never have to memorize cryptic register names like vpv1 or eToUserAll. We hide the codes and flags that do not chart meaningfully and keep the signals that tell a real story.
Built for diagnosis, not just dashboards
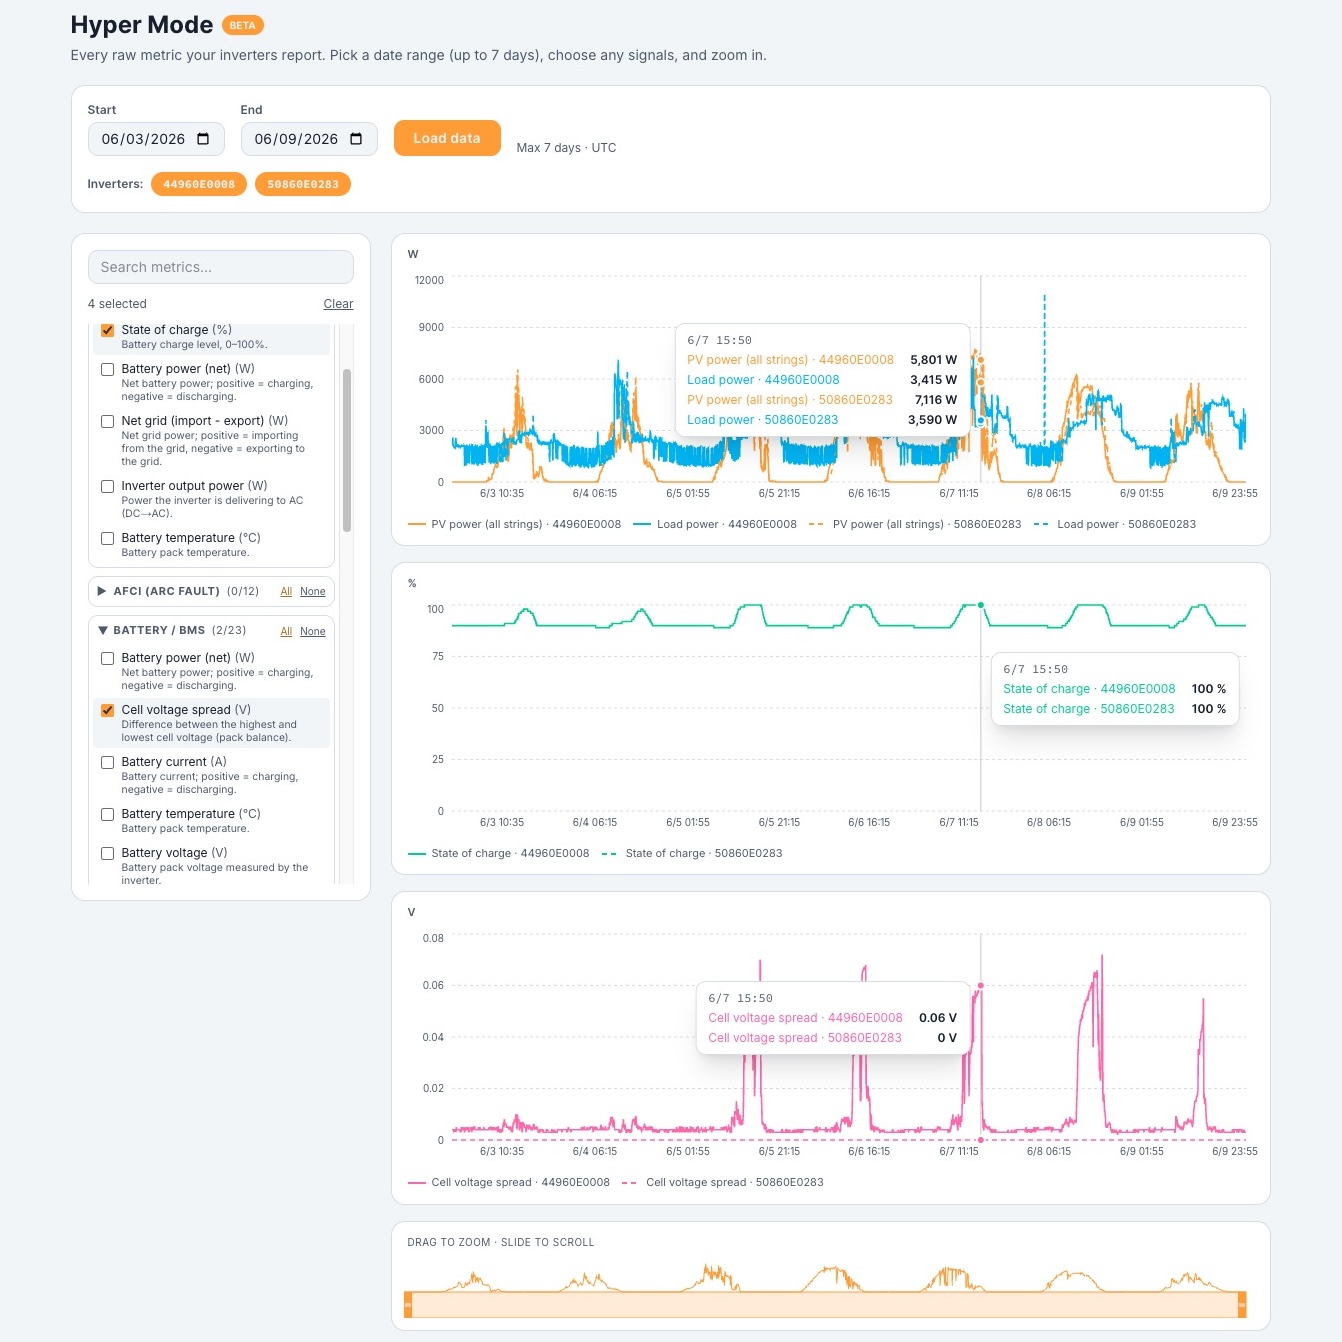
The power of Hyper Mode is in comparison. Pick a date range up to a week and overlay any signals you like, across one inverter or several at once. A few examples of what that makes easy:
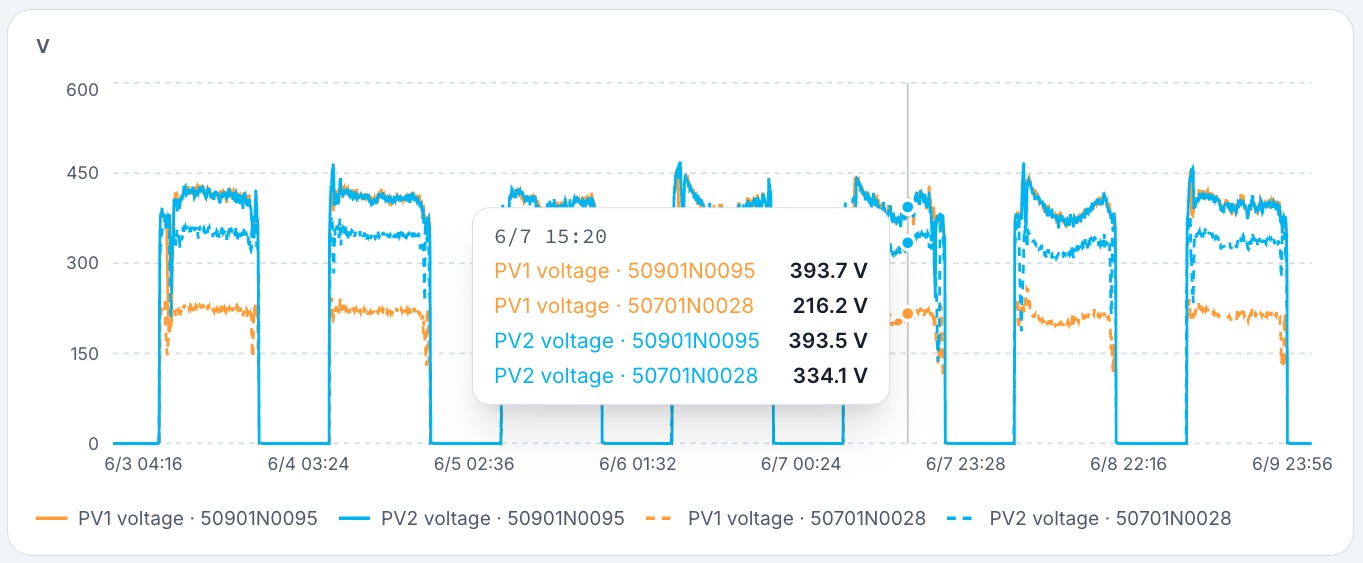
- Find a weak solar string. Put PV1, PV2, and PV3 power on the same chart. If one string consistently lags on a clear day, you have found a shading, soiling, or wiring issue.
- Catch a drifting battery. Watch the cell voltage spread (the gap between the highest and lowest cell). A spread that grows over time is an early sign a pack needs balancing or attention.
- Connect heat to performance. Overlay heatsink temperature with output power to see whether thermal throttling is clipping your production on hot afternoons.
- Compare parallel inverters. Two units that should be sharing load evenly but are not will show up immediately side by side.
Once you spot something, zoom and scroll directly inside the chart to focus on the exact window that matters, down to a single hour out of a week.
Summary fields that do the math for you
Beyond the raw signals, Hyper Mode adds calculated fields so you do not have to do arithmetic in your head. "PV power (all strings)" sums every MPPT on an inverter into one line. "Battery power (net)" shows charging as positive and discharging as negative on a single trace. More are on the way.
How to find it
Hyper Mode lives on the Inverter page. It is a Pro+ feature, and it is free for a limited time on Pro while it is in beta. Choose your dates, pick your metrics, and start digging. If you have ever wished your solar app would just show you everything, this is it.